INTEGRAL Galactic Plane Scanning
Revolution 1049a: Observation start 2011-05-17T06:
59 = MJD 55698.292
Total Observation GTI = 37023 seconds
ISGRI

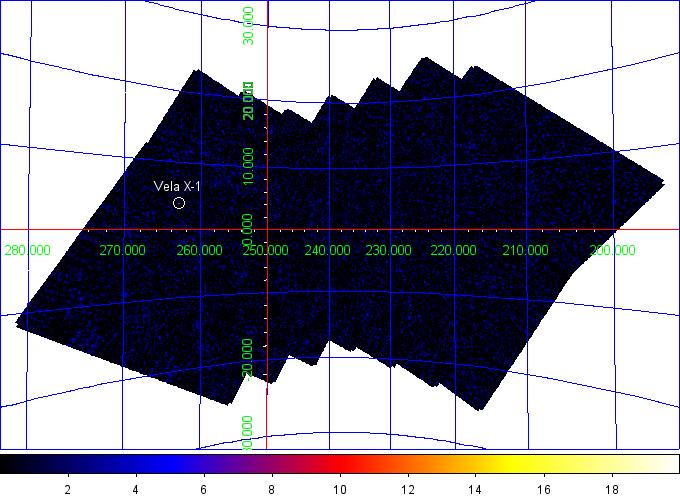
ISGRI significance mosaic images. Top: ISGRI 18-40 keV. Bottom: 40-100 keV
Sources dete cted > 10σ in each band are marked on the image. The table below lists the fitted position, and statistical position al uncertainty in arcmin returned by the mosaic step of
OSA9, of all the sources detected in the 18 - 40 keV
range (band A: 1 Crab ~ 207 cps ) and 40 - 100 keV range (band B: 1 Crab ~ 103 cps ) where available.ISGRI Detected Sources 18-40 keV (A) and 40-100 keV (B)
Source Name             RA       dec   +/-    l        b     A(cps)  +/-   sig  B(cps)  +/-   sig
==================== ========  ======= === ======== ======== ====== ===== ===== ====== ===== =====
Vela X-1              135.534  -40.557 0.5  263.062   +3.931   38.6  0.50  77.5    4.2  0.40  10.4
JEM-X
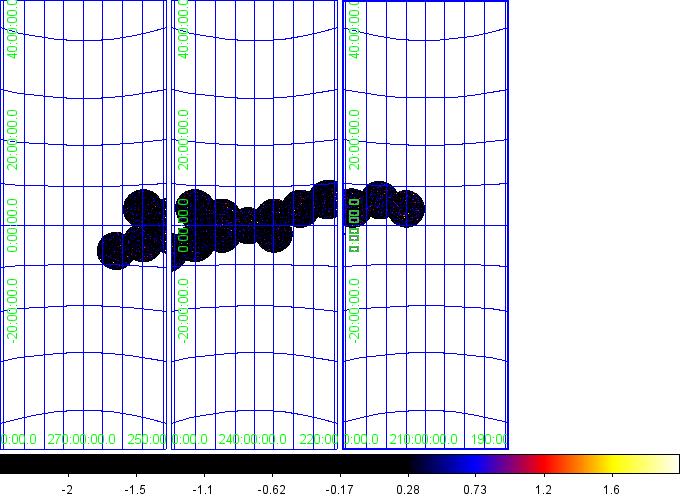
JEM-X1 and JEM-X2 significance mos aic images in 3-10 keV energy band.
Note: Sources labelled were detected in the 3-10 keV image > 5σ and are l isted in the table below. Fluxes are extracted at the known catalogue position of the source with
j_ima_src_locator
in 3-10 keV energy band. .
Source Name             RA      dec       l        b     A(cps)  +/-
==================== ======== ======== ======== ======== ====== =====