INTEGRAL Galactic Plane Scanning
Revolution 1181a: Observation start 2012-06-15T02:15 = MJD 56093.094
Total Observation GTI = 40895 seconds
ISGRI
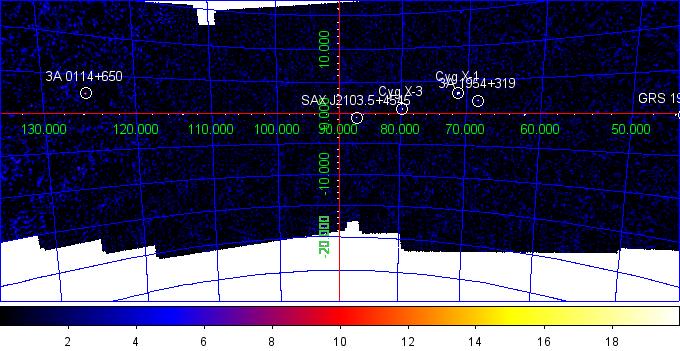
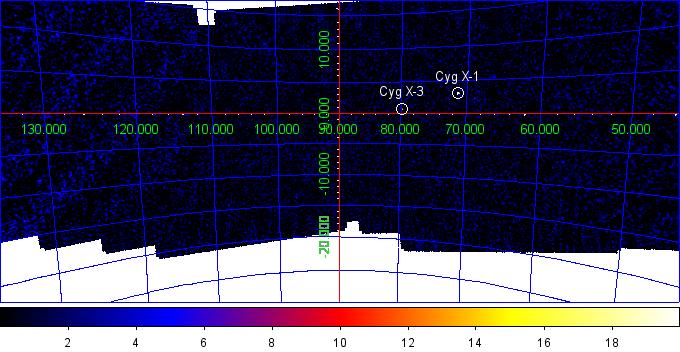
ISGRI significance mosaic images. Top: ISGRI 18-40 keV. Bottom: 40-100 keV
Sources detected > 10σ in each band are marked on the image. The table below lists the fitted position, and statistical positional uncertainty in arcmin returned by the mosaic step of
OSA9, of all the sources detected in the 18 - 40 keV range (band A: 1 Crab ~ 176 cps ) and 40 - 100 keV range (band B: 1 Crab ~ 88 cps ) where available.ISGRI Detected Sources 18-40 keV (A) and 40-100 keV (B)
Source Name             RA       dec   +/-    l        b     A(cps)  +/-   sig  B(cps)  +/-   sig
==================== ========  ======= === ======== ======== ====== ===== ===== ====== ===== =====
Cyg X-1               299.586  +35.203 0.3   71.334   +3.070   70.8  0.34 205.6   28.4  0.26 109.0
Cyg X-3               308.106  +40.957 0.5   79.845   +0.700   26.4  0.36  72.9    5.3  0.28  19.0
SAX J2103.5+4545      315.900  +45.750 1.4   87.130   -0.687    7.1  0.35  20.3    0.0  0.00   0.0
3A 1954+319           298.934  +32.112 1.7   68.408   +1.929    5.9  0.37  16.1    0.0  0.00   0.0
3A 0114+650            19.416  +65.332 1.9  125.666   +2.600    7.0  0.50  14.2    0.0  0.00   0.0
GRS 1915+105          288.813  +10.930 1.7   45.358   -0.240   24.8  1.54  16.0    0.0  0.00   0.0
IGR J21247+5058       321.226  +51.002 3.0   93.367   +0.387    2.6  0.29   8.7    0.0  0.00   0.0
Cyg X-2               326.222  +38.286 4.0   87.334  -11.369    3.8  0.60   6.3    0.0  0.00   0.0